


If you want to save electricity, it is beneficial to know which devices consume how much power and when. To find out, there are measuring sockets that you can plug in between the socket and the plug to measure the power consumption. One option is the Shelly Plug S. This socket can be operated via an app. In addition to the current power, you can also see the power consumption. Unfortunately, there is no diagram showing the power over a period of time. And besides, the socket in this form is dependent on the cloud – not everyone wants that.
What I like about Shellys is that you can also operate them completely locally via web interface or MQTT. Theoretically, you can even flash your own firmware on most of them (info here: https://templates.blakadder.com/index.html ), but that would be too much for me at this point.
Material
- Shelly Plug S
- any Linux server, e.g. RaspberryPi
Installation of MQTT
We need to install an MQTT server on the server to which the Shelly can send the data:
|
1 |
sudo apt install mosquitto mosquitto-clients |
Configuration of Shelly
When first started, the Shelly opens a Wi-Fi hotspot that you can use to connect to your mobile phone, for example. In the browser, enter the address http://192.168.33.1, where you can then enter the access data for your WLAN. Then the Shelly restarts and you can open the web interface from the home network and make all the settings there.
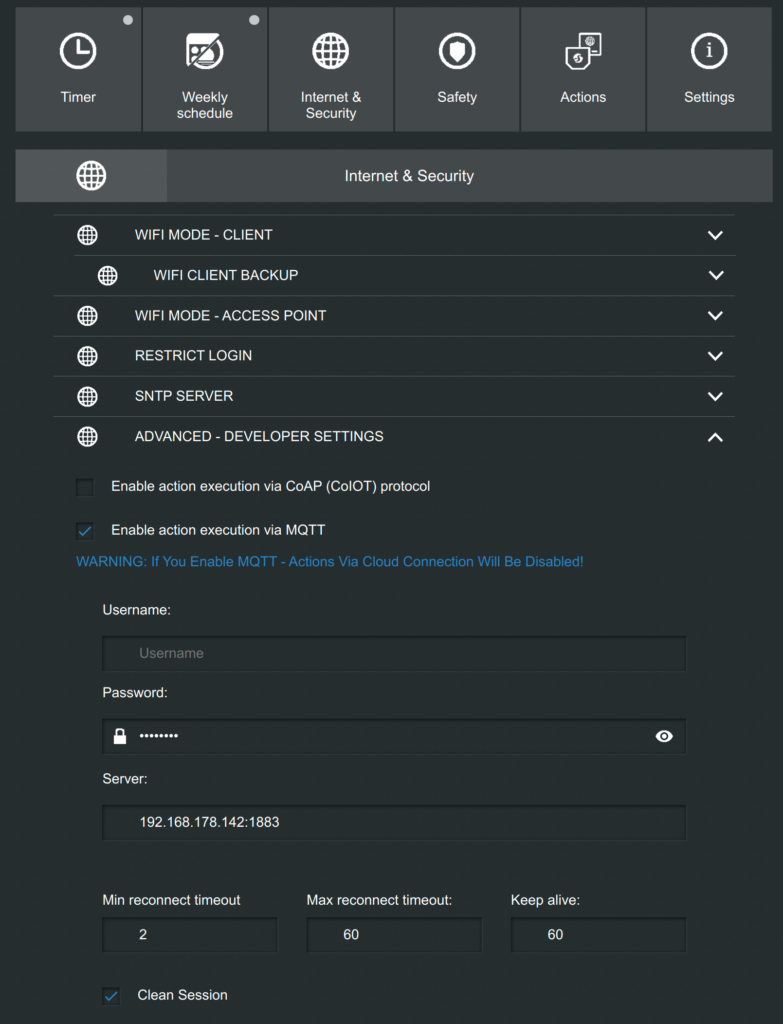
Under “Internet & Security”, “Advanced Developer Settings”, there is the item “Enable action execution via MQTT”. We activate this and then enter the IP address of the server and the port (default is 1883) under “Server”. Afterwards, do not forget to save!
Another important setting is “POWER ON DEFAULT MODE” under “Settings”, that is, what should happen if the Shelly loses power (e.g. in the event of a power failure). This depends on what is connected to the Shelly. For a lamp, it makes sense to switch it off after a power failure, while a refrigerator should always stay on.
Test
The command
|
1 |
mosquitto_sub -v -h localhost -t "#" |
displays all messages in the terminal that are sent via MQTT. After at least 30 seconds (the Shelly sends data every 30 seconds), there should be an output that looks something like this:
|
1 2 3 4 5 |
shellies/shellyplug-s-5B3FE7/relay/0/power 6.20 shellies/shellyplug-s-5B3FE7/relay/0/energy 1193685 shellies/shellyplug-s-5B3FE7/relay/0 on shellies/shellyplug-s-5B3FE7/temperature 31.88 shellies/shellyplug-s-5B3FE7/overtemperature 0 |
The important points here are “Power” (current power in watts) and “Energy” (total consumption in watt-minutes).
Python Script
First, the following Python modules must be installed:
|
1 |
sudo pip3 install influxdb paho-mqtt |
My code for this is the following:
|
1 2 3 4 5 6 7 8 9 10 11 12 13 14 15 16 17 18 19 20 21 22 23 24 25 26 27 28 29 30 31 32 33 34 35 36 37 38 39 40 41 42 43 44 45 46 47 48 49 50 51 |
#!/usr/bin/env python3 import paho.mqtt.client as mqtt import json from influxdb import InfluxDBClient influxclient = InfluxDBClient(host='localhost', port=8086) influxclient.switch_database('solaranzeige') try: # This is the Subscriber def on_connect(client, userdata, flags, rc): print("Connected with result code "+str(rc)) client.subscribe("shellies/shellyplug-s-5B3FE7/relay/0/power") client.subscribe("shellies/shellyplug-s-5B3FE7/relay/0/energy") def on_message(client, userdata, msg): if(msg.topic == "shellies/shellyplug-s-5B3FE7/relay/0/power"): leistung = float(msg.payload.decode()) print(leistung) json_body = [ { "measurement": "shellyplugs1", "fields": { "leistung": leistung, } }, ] influxclient.write_points(json_body) if(msg.topic == "shellies/shellyplug-s-5B3FE7/relay/0/energy"): energie = float(msg.payload.decode()) print(energie) json_body = [ { "measurement": "shellyplugs1", "fields": { "energie": energie, } }, ] influxclient.write_points(json_body) client = mqtt.Client() client.connect("localhost",1883,60) client.on_connect = on_connect client.on_message = on_message client.loop_forever() except Exception as e: print("Fehler: " + str(e)) |
Short explanation: (These positions must be adjusted!)
Lines 7-8: A connection to the database is established.
Lines 14-15: The topics of power and energy of the shelly are subscribed. Additional topics can also be added here, e.g. for the operating temperature or other shellys, see section “Test”).
Lines 19-30: Here, too, the topic must be adapted. In this section, the value is then output in the console and then entered in the database in the measurement “shellyplugs1” in the field “performance”. This section must also be repeated if further topics are added after line 15.
Line 44: A connection to the MQTT broker is established.
This script can now run, for example as a Systemd Service Unit, and then writes the data to the Influx database, from where it can be visualised with Grafana, for example.
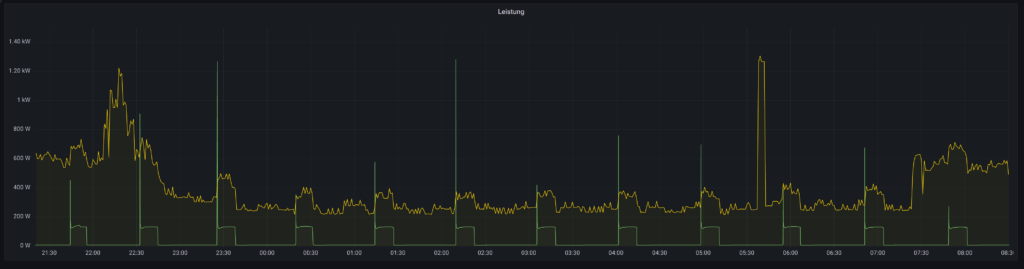
Example of visualisation with Grafana
The Shelly is connected to my refrigerator. In the following diagram, you can see that the spikes in total power consumption (yellow) at night come from the refrigerator (green):
Leave a Reply