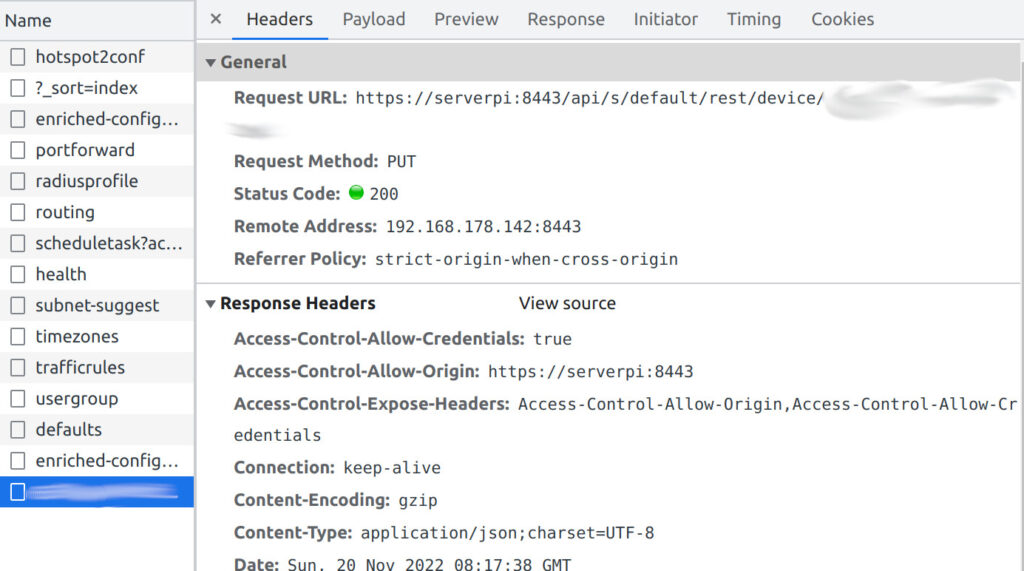
Category: Tutorial

Fixing the Tribit Maxsound Plus charging electronics

About a year ago, I reported that my Bluetooth speaker had broken down and was able to determine that it was probably due to the charging electronics. At that time, however, I could not find a suitable charging board.

If you search for the right term, you will quickly find something suitable. My idea at the time was to look for a 7.4 or 8.4V charging board. But the term that is needed here is “2S”, because we have 2 3.7V batteries that are connected in series. So I bought this board for just under €5:
https://www.ebay.de/itm/275276607102?var=575545698944

Installation

Unfortunately, I couldn’t use the USB-C connection on the board because otherwise it wouldn’t have fit into the speaker’s housing. So I continued to use the micro-USB connection. The wiring is quite simple: The cable of the micro-USB connection is connected to VIN/GND and both the connections of the battery and the connections of the main board of the speaker are connected to BAT/GND. Now the speaker can be charged and used as usual.

Ladeplatine von oben
Testaufbau

I was then able to hide the board in the very back of the speaker.

Verstecken der Ladeplatine

Before that, I drilled a hole in the housing and filled it with hot glue at the approximate position of the LEDs of the charging board, so that you can also see from the outside whether the speaker is charging or is already full.

LadeLED von außen

Next, I wanted to desolder the old charging LEDs, as I didn’t need them anymore and the red LED was permanently on, draining the battery.

Unfortunately, that didn’t work out as I had imagined, but at least I destroyed the LED with my action, which wasn’t what I had in mind, but had the same effect in the end.

And once again, a device was saved from being thrown away. 😉

Cleaning function for Raspberry display

When my display (here you can see how I installed it) is dirty, it is very practical to have a “cleaning function” that deactivates all inputs for a short time so that nothing is modified while cleaning. Here I would like to show you how I implemented this.

Installing the web server

For this function, I use a web server that receives a request. This then executes a shell script that disables the input from the touch screen.

PHP Script

Then I use a simple PHP script that starts a shell script as user “pi”:

I saved this in /var/www/html/cleanmode.sh.

Shell-Script

For the shell script, one must first find out the ID of the touch screen. With the following command, all IDs can be displayed:

Then try all the IDs with

until the touchscreen no longer works. In my case it was ID 7.

The following shell script must then be adapted:

The time in line 2 can also be adjusted as desired. My script is located in /home/pi/cleanmode.sh. If this is different for you, you must change the path in the PHP script accordingly.

Grant the user www-data root rights

In order for the user www-data (this is used by the web server) to be able to execute the shell script as user pi, he needs root rights.

WARNING: Giving the user www-data root rights is a major security risk. Under no circumstances should this be done on a web server accessible from the Internet!

We open the file /etc/sudoers with the command

and enter the following line under “User privilege specification”:

After saving with Ctrl+O, exiting with Ctrl+X and restarting, the user www-data now has root rights. Now open the following URL in the browser:

http://[IP_OF_YOUR_RPi]/cleanmode.sh

the touchscreen should switch off and then switch on again after 60 seconds.

Cleaning function in Homeassistant

Homeassistant is currently running on my display. I would like to have the cleaning function as a button there. I would also like a timer that shows me how much time I have left until the touchscreen is activated again.

I have stored the following configuration in config.yaml:

The first is the call to the URL, the second is the timer.

I then created a button in the Homeassistant UI under “Helper”.

An automation then controls the whole thing, so it starts the timer and then calls up the URL:

Homeassistant Automatisierung Putzfunktion

And here in text form:

How to read out mobile alerts sensors locally with a proxy and send them to Homeassistant

Almost two years ago I published a post about how I read my Mobile Alerts temperature sensors via web interface using a Python script. This variant worked for me and still works without any problems. However, the other day I came across another option that I like much better because it is more reliable and independent of the cloud. With a proxy, which is switched between the gateway and the Internet, the data can be intercepted and processed further.

For this, there is the program “maserver“. It also makes the settings directly on the gateway. This then sends the data to an MQTT broker. For me it runs on a RaspberryPi with Ubuntu Server 22.04.

Preparations

On the server, nodejs and npm must first be installed:

After that you can download maserver:

The folder “MMMMobilealerts” now contains the maserver.

Configuration

In it you will find the file “config-example.json”. Rename this to “config.json”. The following configuration options are available:

  • localIPv4Address: The IP address of the device on which the proxy is running. Required only if it has multiple IP addresses, for example, if it is connected via multiple network interfaces or Docker or a VPN server is running on it.
  • mqtt: The address to the MQTT broker.
  • mqtt_home: The topic in which the data should be published on the MQTT broker.
  • mqtt_username, mqtt_password, logfile: self-explanatory.
  • logGatewayInfo: Whether to display info about found gateways
  • proxyServerPort: The port on which the proxy server should run.
  • mobileAlertsCloudForward: Whether to send the data to the Mobilealerts Cloud.
  • serverPost: The data can also be sent via POST.
  • serverPostUser, serverPostPassword, locale: self-explanatory.

My configuration then looks like this:

Installation

The proxy is installed with

while being in the “maserver” directory.

Start

The program can be started with:

It automatically finds the gateway in the network and configures itself in the gateway as a proxy. After at least 15 minutes, the first data should be visible.

Sending data to Homeassistant

In Homeassistant, we first add the MQTT integration under “Settings”->”Devices and Services”->”Add Integration”.

The configuration of the individual sensors is then done via the configuration.yaml file and looks like this, for example:

Here, XXXXXXXXXX is the 12-digit device ID found in the Mobile Alerts app or directly on the back of the sensors.

After a restart, the data should appear in Homeassistant:

Mobile Alerts Sensoren in Homeassistant

Disable Unifi Accesspoints via API

In the Unifi Controller there is the option of (de)activating Wi-Fi networks time-controlled. What is not possible, is to switch individual access points on and off time-controlled. A quick search on the web revealed that this can be done via the API of the Unifi Controller:

1. Finding out the ID of the Unifi device

This is where the developer tools in the browser come in handy. Once opened, you can see all the network requests that the page makes in the “Network” tab. If you now change a setting of an access point (under “Unifi Devices”), you will see a request in the following format:

https://IP:8443/api/s/default/rest/device/XXXXXXXXXXXXXXXXXXXXXXXX

Eine HTTP Anfrage des Unifi Controllers

The 24-digit ID at the end of the URL is the ID of the device you just edited.

2. Script to activate and deactivate

I use the following bash script to activate the AP:

The script can run on any server, e.g. a RaspberryPi (which also runs my Unifi Controller) and be automated via cronjob.

In lines 3, 5, 7 and 9, the values must be adjusted accordingly. To deactivate the AP, the “false” in line 15 must be changed to a “true”.

Source: https://community.ui.com/questions/DISABLE-ENABLE-your-AP-with-time-scheduler-Turn-off-radio-transmitter/3c32439b-a731-4de9-9130-d82d68f409c0

How to visualise Shelly Plug S in Grafana

If you want to save electricity, it is beneficial to know which devices consume how much power and when. To find out, there are measuring sockets that you can plug in between the socket and the plug to measure the power consumption. One option is the Shelly Plug S. This socket can be operated via an app. In addition to the current power, you can also see the power consumption. Unfortunately, there is no diagram showing the power over a period of time. And besides, the socket in this form is dependent on the cloud – not everyone wants that.

What I like about Shellys is that you can also operate them completely locally via web interface or MQTT. Theoretically, you can even flash your own firmware on most of them (info here: https://templates.blakadder.com/index.html ), but that would be too much for me at this point.

Material

Installation of MQTT

We need to install an MQTT server on the server to which the Shelly can send the data:

Configuration of Shelly

When first started, the Shelly opens a Wi-Fi hotspot that you can use to connect to your mobile phone, for example. In the browser, enter the address http://192.168.33.1, where you can then enter the access data for your WLAN. Then the Shelly restarts and you can open the web interface from the home network and make all the settings there.

Under “Internet & Security”, “Advanced Developer Settings”, there is the item “Enable action execution via MQTT”. We activate this and then enter the IP address of the server and the port (default is 1883) under “Server”. Afterwards, do not forget to save!

Shelly MQTT Einstellungen

Another important setting is “POWER ON DEFAULT MODE” under “Settings”, that is, what should happen if the Shelly loses power (e.g. in the event of a power failure). This depends on what is connected to the Shelly. For a lamp, it makes sense to switch it off after a power failure, while a refrigerator should always stay on.

Test

The command

displays all messages in the terminal that are sent via MQTT. After at least 30 seconds (the Shelly sends data every 30 seconds), there should be an output that looks something like this:

The important points here are “Power” (current power in watts) and “Energy” (total consumption in watt-minutes).

Python Script

First, the following Python modules must be installed:

My code for this is the following:

Short explanation: (These positions must be adjusted!)

Lines 7-8: A connection to the database is established.
Lines 14-15: The topics of power and energy of the shelly are subscribed. Additional topics can also be added here, e.g. for the operating temperature or other shellys, see section “Test”).
Lines 19-30: Here, too, the topic must be adapted. In this section, the value is then output in the console and then entered in the database in the measurement “shellyplugs1” in the field “performance”. This section must also be repeated if further topics are added after line 15.
Line 44: A connection to the MQTT broker is established.

This script can now run, for example as a Systemd Service Unit, and then writes the data to the Influx database, from where it can be visualised with Grafana, for example.

Example of visualisation with Grafana

The Shelly is connected to my refrigerator. In the following diagram, you can see that the spikes in total power consumption (yellow) at night come from the refrigerator (green):

Grafna Grafik

How to read out the SDM630 Modbus meter

In this tutorial I will show you how to read out an SDM630 Modbus meter with a RaspberryPi (or any other Linux computer). The tutorial is intended more as a basis for your own project. There is plenty of ready-made software, such as Smartmeter.

Hardware

  • SDM630 Meter (e.g. this one)
  • Modbus USB Adapter (e.g. this one)
  • Cables
  • 2x 150 Ohm resistor

On the upper flap of the meter there are the terminals A+ and B-. These are connected to terminals A and B on the adapter. A terminating resistor of 150 Ohm is connected to the end of the bus or to the last and first device. Since I only have 2 devices, this is the meter and the USB adapter.

Theoretically, several meters can be connected to the bus in parallel.

Software

Configuration of the meter

Various settings must be made on the meter for the Modbus. This is how it works with my meter:

  1. Press and hold the E button
  2. Enter password (default: 1000)
  3. Press and hold the E button
  4. The message “Set Addr” appears
  5. Select the setting by pressing and holding the E button and change the address with the arrows. Exit the setting by pressing and holding the E button.
  6. Use the arrows to select the settings “Set baud”, “Set Pari” and “Set Stop” and set them as well.

The address is used to identify the device on the bus. If you have only one device, you can leave the address at 1, if you have several, give the devices different addresses.

The baud rate is simply the transmission speed. With a higher baud rate, however, only a shorter cable length is possible.

I do not use parity, so I use “none”

The stop bit can be left at 1

Read out values with script

In addition to the settings you made before, you need another value: the USB port. You can be quite successful here by trial and error. With ls /dev/ttyUSB* you can display all ports. In my case, there was only one.

This is my code:

In line 1, the Modbus module is imported from Python. You may need to install this:

In the next line, the device is initialised. Here you may have to change the USB port and the Modbus address. After that, there is a very long part, through which the script later knows which value has which number and which unit. The “use” can be used to determine whether the value is to be used or not. To do this, simply set the value to True or False. Line 177 contains a for loop that is executed once for each value. Line 178 checks whether the value should be used. Everything after that (don’t forget the indentations) can now be programmed freely. In my example, all the data is simply printed. The line

returns the value (the one at which the for loop is currently). With

you get the unit.

For example, this code example writes the data to an Influx database.

Now have fun programming!

How to read Mobile Alerts sensors without Rest API

I have some Mobile Alerts sensors in the house. I originally wanted to read them out with the RaspberryPi via the Mobile Alerts Rest API. But since only certain sensors work there (mine unfortunately don’t), I tried a slightly different method. This variant is not as reliable and also a bit complicated, but at least it works.

Hint: There is another method

Preparations

The sensors should already be connected to the gateway and integrated into the Mobile Alerts App. In the app settings you will find the phone ID relatively far down. This will be needed later.

Then visit the page https://measurements.mobile-alerts.eu/Home/SensorsOverview?phoneid=XXXXXXXXXXXX

At the end, the phone ID must be added. You should now see all the sensors there.

Creating the script

Now we need some lines from the source code. This is how the Python script that reads out the data will work later. To do this, right-click on the page and select “Show page source” (this may vary depending on the browser).

Here, for example, I see that the temperature of the bathroom (“Badezimmer” in German) is in line 66. The humidity is in line 70, and this is also the weak point of the script. If the temperature of the bathroom is no longer in line 66, the script no longer works and must be adapted. As a rule, such a change only occurs when another sensor is added or removed.

This is already the script. For the time being, it only reads out the data.

Line 4: The source text of the web page is downloaded here. It is saved in /home/pi/sensors.txt. (don’t forget to replace the phone ID) (Update: Since 15.4.21 the download via wget is blocked by Mobilealerts. The additional option “-U firefox” makes the website think that it is a firefox browser. I hope that this will continue to work).

Lines 5 and 6: Here a variable is set to the corresponding lines (66 and 70) and then everything is removed except for the number. In the case of temperature, the comma must be replaced by a dot.

Lines 8 and 9: The read data is output here. Of course, something completely different can be written here. For example, the data could be written to a database or processed in some other way (e.g. if it is too hot in the bedroom but colder outside, the window should be opened).

Line 10: The source text is deleted. It is no longer needed.

I hope I could help you with this short tutorial 😉